Global emissions in the power sector
Carbon emissions from energy production have consistently been a major source across all industries worldwide, accounting for around 75.7% of total greenhouse gas emissions. Among different energy sectors, electricity and heat generation rank first, contributing 29.7% of global emissions, followed by transport at 13.7% and manufacturing and construction at 12.7%.
The power industry has long been at the core of the global energy system. Direct emissions from coal- and gas-fired power generation significantly influence national decarbonization efforts. In addition, electricity serves as a fundamental energy source for most industries, and therefore also affects indirect emissions in downstream sectors such as steel, chemicals, cement, and data centers.
Power sector structure
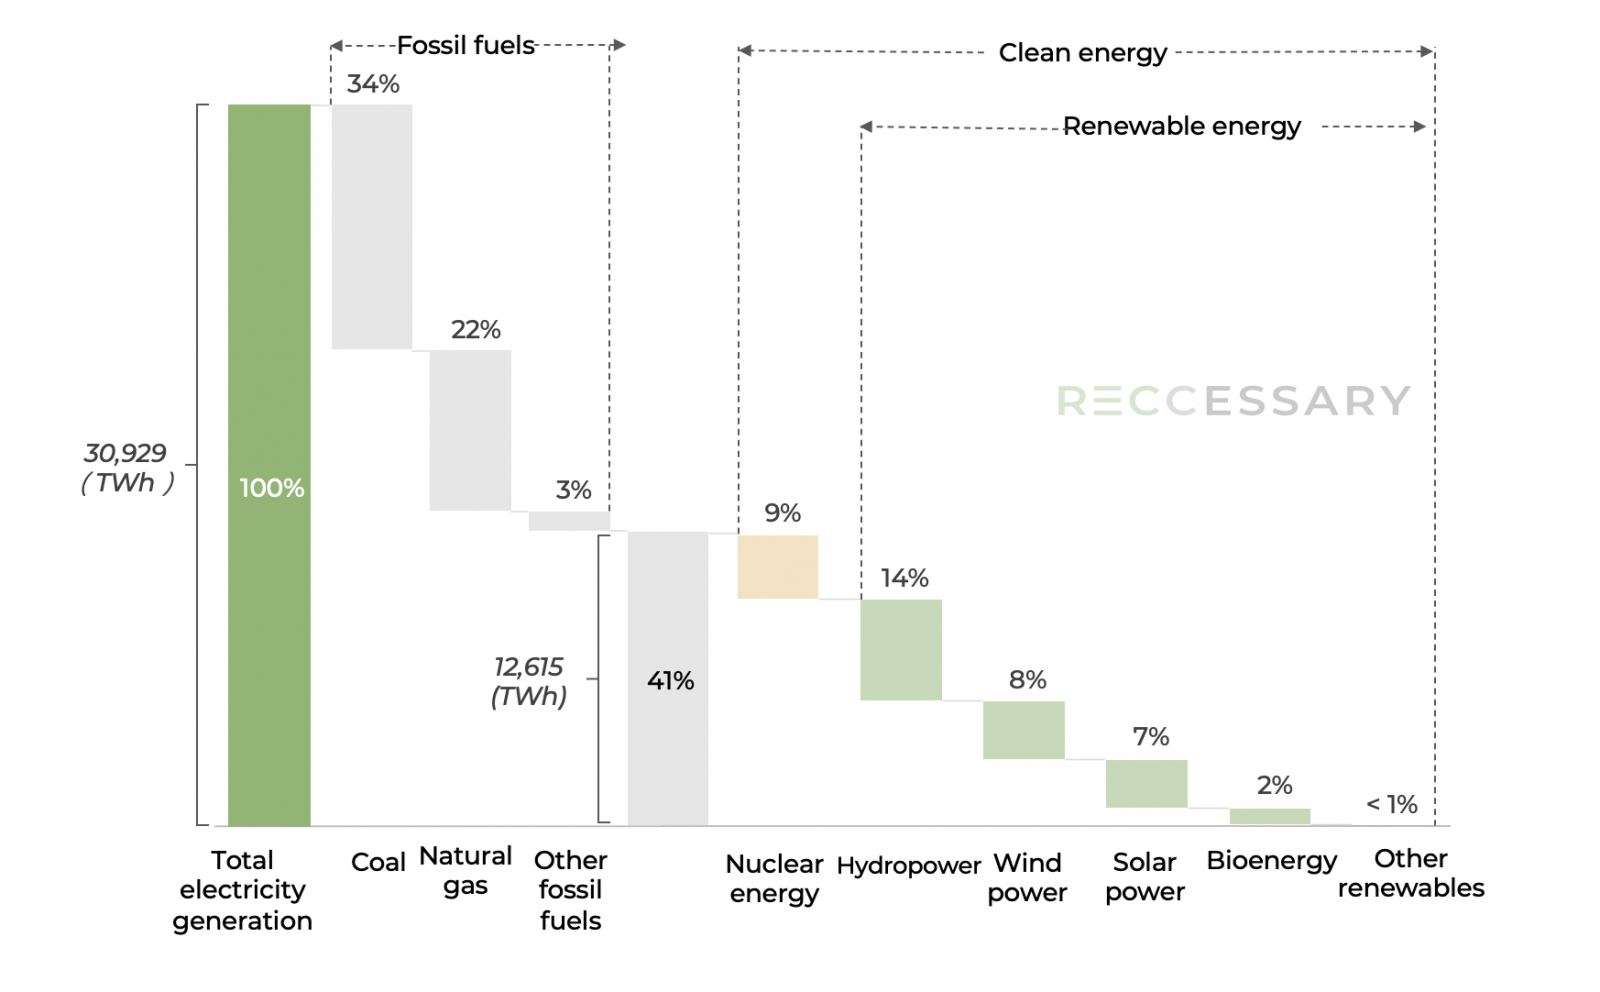
Figure 1. Global electricity generation mix, 2024
Fossil fuels
Fossil fuels include coal, natural gas, and oil, which are hydrocarbons formed over millions of years through the accumulation and compression of organic matter. Their combustion releases large amounts of carbon dioxide and represents the primary source of carbon emissions in the global power sector.
In 2024, electricity generated from fossil fuels accounted for approximately 60% of total global generation. Due to its significant impact on climate change, reducing reliance on fossil fuels has become a central challenge in the energy transition for many countries.
Clean energy
Clean energy broadly refers to energy sources that produce no carbon emissions or have very low emission intensity, including:
- Nuclear energy: Electricity generated from heat produced by nuclear fission. Aside from limited emissions associated with uranium mining, the generation process itself produces almost no carbon emissions. However, concerns over safety and waste management make it one of the most controversial energy sources.
- Renewable energy: Energy derived from naturally replenished sources, such as hydropower, wind, solar, and bioenergy.
Clean energy is defined by its emission profile rather than whether the source is renewable. Any energy source with low carbon emissions and minimal pollution falls within this category, and it is therefore also referred to as low-carbon energy.
Carbon intensity of the power sector
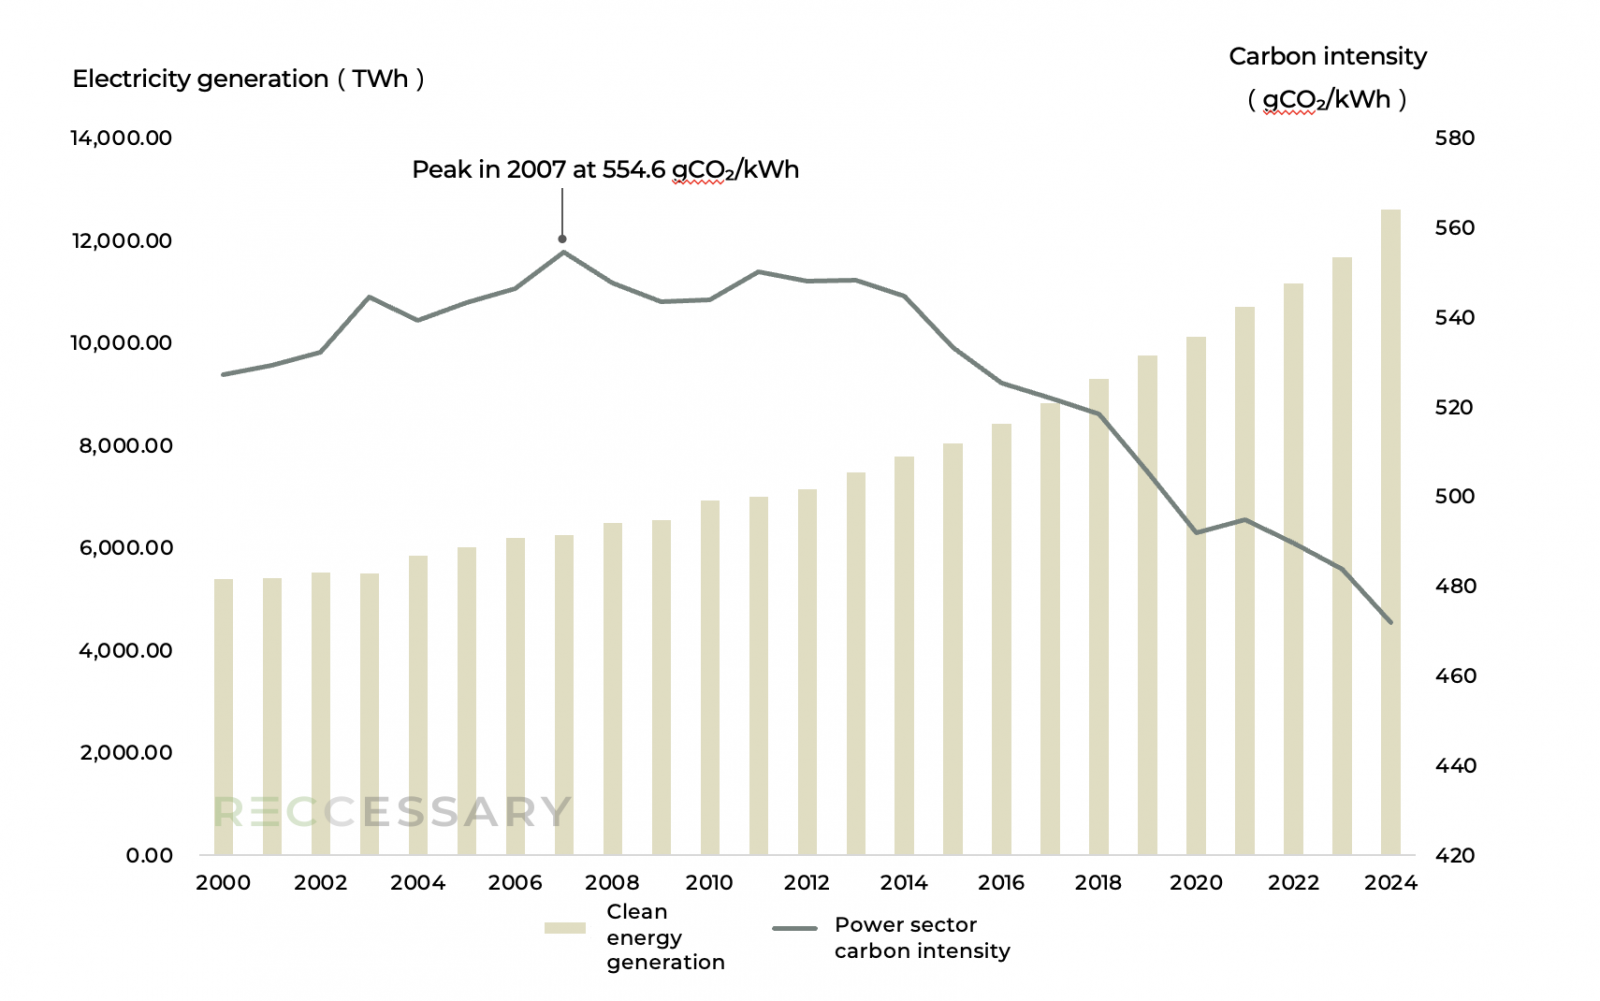
Figure 2. Trends in global power sector carbon intensity and clean energy generation
The emissions intensity of the global power system has shown a clear “rise-then-decline” trend since 2000. In 2007, global power sector carbon intensity reached a peak of 554.6 gCO₂/kWh, reflecting a generation mix dominated by coal at the time. This was followed by a gradual shift, with natural gas partially replacing coal, alongside the rapid expansion of renewable energy and improvements in energy efficiency, leading to a moderate decline in carbon intensity.
After 2015, the accelerated growth of wind and solar power contributed to a more pronounced reduction in global power sector carbon intensity. By 2024, the global average had declined to 471.9 gCO₂/kWh, marking the lowest level in nearly two decades.
The power sector remains one of the largest sources of energy-related emissions globally. A reduction in carbon intensity is therefore critical to achieving global net-zero targets. Nevertheless, the development of clean energy continues to show significant regional disparities. The following section will examine different regions worldwide and provide a more detailed analysis of their energy transition pathways.
Global transition trends in the power sector
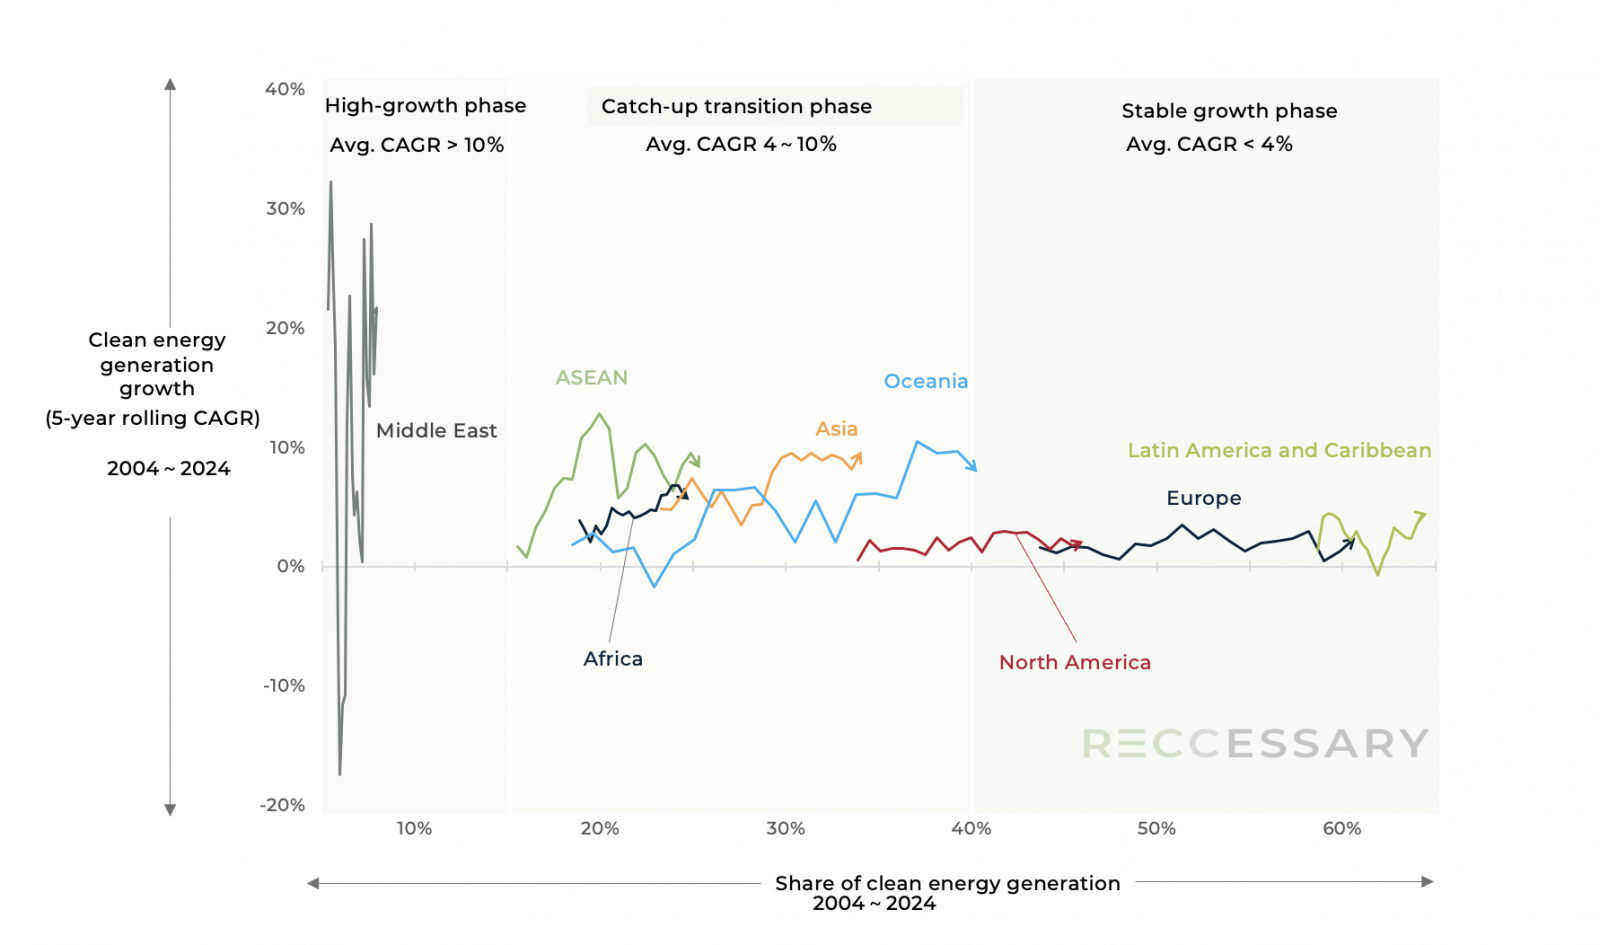
Figure 3. Three stages of global power sector transition: growth momentum and penetration of clean energy
The figure above presents an analysis of global trends over the past two decades in terms of “energy transition momentum” and “clean energy penetration.” The starting and ending points of each regional arrow represent 2004 and 2024, respectively. Regions are categorized into three groups based on their growth rates:
Category 1: High-growth phase (Avg. CAGR > 10%)
Middle East:
The region remains highly dependent on fossil fuels. In 2024, 92% of electricity generation in the Middle East came from fossil fuels, while only 3% was generated from wind and solar power. Overall, the region’s annual carbon intensity reached 637.24 gCO₂/kWh, significantly higher than the global average of 471.89 gCO₂/kWh.
Despite strong policy interest in renewable energy across countries in the region, substantial investment in natural gas continues to flow into the Middle East. In addition, the region is still at an early stage of renewable energy development, resulting in slower progress toward decarbonization.
Category 2: Catch-up transition phase (Avg. CAGR 4–10%)
Asia and ASEAN member states:
Growth in Asia is largely driven by China, which accounts for more than half of the world’s installed wind and solar capacity. Between 2000 and 2024, China’s actual electricity generation from wind and solar increased from 0.61 TWh to 1,836 TWh, demonstrating a globally leading pace of expansion.
Vietnam has emerged as a key driver of renewable energy growth in ASEAN in recent years. Supported by feed-in tariff policies between 2017 and 2019, its wind and solar generation increased from 5.54 TWh in 2019 to 11.74 TWh in 2020 within a single year. Other countries, such as Indonesia, have also actively developed hydropower, further contributing to the region’s energy transition momentum.
Africa:
Africa is the only region within the catch-up transition phase with an average 5-year rolling CAGR below 5%. Despite being the sunniest continent, solar power generation reached only 36 TWh in 2024, accounting for just 3.68% of total electricity generation. Looking ahead, Africa is expected to expand electricity access while reducing its reliance on costly natural gas and maximizing the potential of its abundant renewable energy resources.
Oceania:
New Zealand benefits from strong hydropower and geothermal resources, enabling renewable energy to account for 85% of its electricity generation without the use of nuclear power. In contrast, despite nearly a decade of rapid growth in solar energy, clean energy accounts for only 35% of Australia’s electricity mix, lower than expected. Coupled with its continued reliance on coal at 45%, the country remains in a phase of accelerating energy transition.
Category 3: Stable growth phase (Avg. CAGR < 4%)
North America:
Canada benefits from well-developed hydropower, which accounts for 54% of its electricity generation, resulting in a clean energy share of 77.69%. The United States, while being one of the largest electricity consumers globally, has also seen substantial growth in renewable energy driven by strong power demand, bringing its clean energy share to 40%. In contrast, Mexico relies heavily on natural gas to meet domestic electricity demand, resulting in a relatively low clean energy share of 24.59%.
Europe:
Clean energy accounts for 61.28% of electricity generation in Europe. The surge in natural gas prices following Russia’s invasion of Ukraine in 2022 accelerated the region’s energy transition. However, despite a clean energy share well above the global average, countries such as Russia, Germany, and Turkey remain major sources of carbon emissions, highlighting the significant divergence in Europe’s energy structure.
Latin America and the Caribbean:
Supported by strong hydropower generation, which accounts for 40.86% of electricity supply, the region’s clean energy share reaches 64.55%. In addition, abundant renewable resources have enabled continued growth in solar and wind power, which increased by 7% and 9%, respectively, in 2024. Looking ahead, the region is expected to further focus on meeting energy demand in remote areas, with solar and wind power playing a greater role in enhancing energy independence.
Source
- WRI, 2024: Where Do Emissions Come From?
- Ember: Explore-Countries & Regions
Update:2026/3/19
