Global emissions in the hydrogen sector
Global hydrogen demand in 2024 was close to 100 million tonnes (Mt), primarily driven by traditional industries, including refining, ammonia, methanol, and direct reduced iron (DRI).
A key characteristic of hydrogen is that it produces almost no carbon dioxide during use, with most emissions occurring during the production stage. Conventional production methods, such as brown and gray hydrogen, require significant amounts of coal and natural gas, leading to carbon emissions that account for 2% of global CO2 emissions.
Emission factors and mitigation measures in the hydrogen sector
.png) Figure 1. Emission factors of fossil fuel-based hydrogen production
Figure 1. Emission factors of fossil fuel-based hydrogen production
Brown hydrogen
Brown hydrogen is produced through the high-temperature reaction of coal and steam, and is one of the commonly used hydrogen production methods. It accounts for roughly one-fifth of global hydrogen production and is mainly concentrated in China. Its main drawback is extremely high carbon emissions, with an emission factor of approximately 22–26 kg CO₂-eq per kg of hydrogen.
Gray hydrogen
Gray hydrogen is produced using natural gas or methane, the primary component of natural gas, through steam methane reforming. Its emission factor is about 11 kg CO₂-eq per kg of hydrogen. Natural gas is currently the dominant source for hydrogen production, accounting for about 62% of global output.
Blue hydrogen
Blue hydrogen is produced from fossil fuels in combination with carbon capture and storage (CCS) technologies, which can capture and store a significant portion of carbon dioxide generated during production, thereby reducing emissions. However, the capture rate does not translate directly into a proportional reduction in overall emission intensity. Capture rates typically reflect only the proportion of emissions captured during the hydrogen production process and do not account for upstream and midstream emissions, such as those associated with the extraction, processing, compression, and transportation of natural gas.
As a result, according to the International Energy Agency (IEA), even with a capture rate as high as 93%, around 70% of emissions associated with blue hydrogen originate from the natural gas supply chain rather than the production process itself. This means that the overall emission factor of blue hydrogen remains relatively high.
- Coal-based blue hydrogen (93% CCS): 2.6–6.3 kg CO₂-eq per kg of H₂
- Natural gas-based blue hydrogen (93% CCS): 1.5–6.2 kg CO₂-eq per kg of H₂
These figures indicate that the carbon intensity of hydrogen production is more strongly influenced by the cleanliness of the energy source than by the efficiency of carbon capture alone. The following section introduces the emission factors of hydrogen produced via water electrolysis using clean energy.
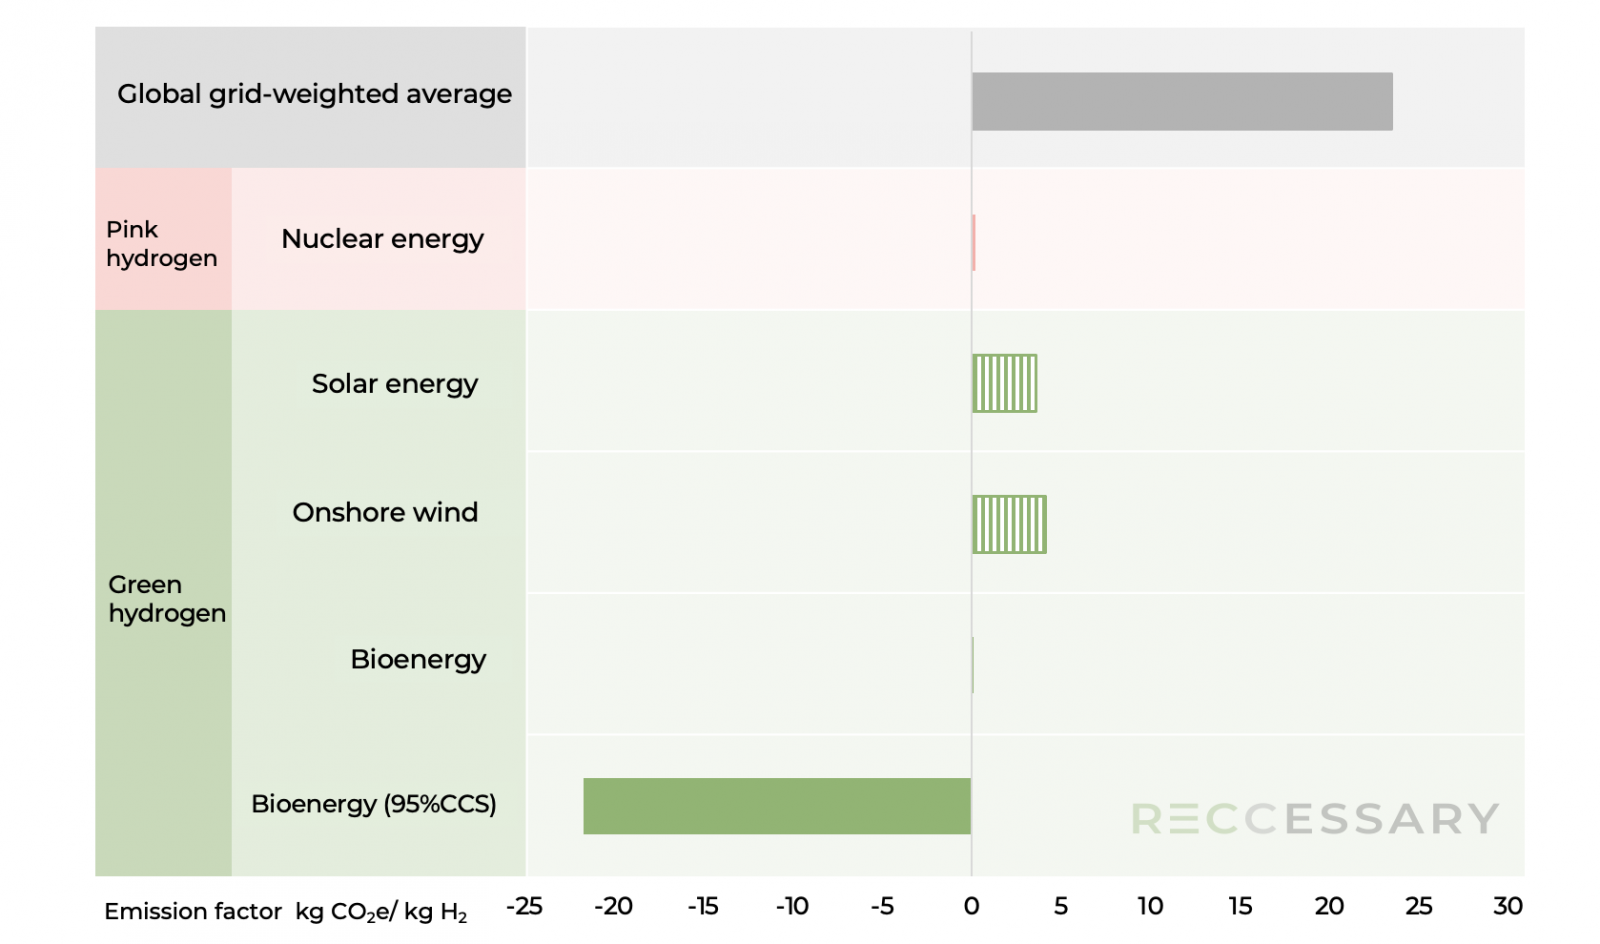 Figure 2. Emission factors of hydrogen production via water electrolysis
Hydrogen production via water electrolysis refers to the process of splitting water (H₂O) into hydrogen (H₂) and oxygen (O₂) using electricity. The process itself produces no direct emissions, and its carbon intensity depends entirely on the source of electricity used. In most countries, electricity grids are still dominated by fossil fuels. As a result, the global grid-weighted average emission factor for hydrogen produced via electrolysis reaches as high as 23.5 kg CO₂-eq per kg of H₂.
The following outlines the emission factors of hydrogen production via electrolysis using different clean energy sources.
Pink hydrogen
Pink hydrogen is produced using electricity generated from nuclear energy to power water electrolysis. Apart from minor emissions associated with uranium mining and equipment manufacturing, nuclear power generation produces almost no carbon emissions during operation. Its emission factor is approximately 0.1–0.3 kg CO₂-eq per kg of H₂.
Green hydrogen
Solar power and onshore wind: Direct emissions are nearly zero. However, when considering a full life cycle approach, some emissions arise from the manufacturing of solar panels and wind turbines.
Bioenergy: Unlike fossil fuels, which release carbon that has been stored underground for millions of years, bioenergy emits carbon that originates from the contemporary atmosphere and is part of a short-term carbon cycle. As such, it does not result in a net increase in atmospheric carbon dioxide.
When combined with carbon capture technologies, bioenergy can result in negative emissions, as the captured carbon dioxide is effectively removed from the natural carbon cycle.
Hydrogen production cost
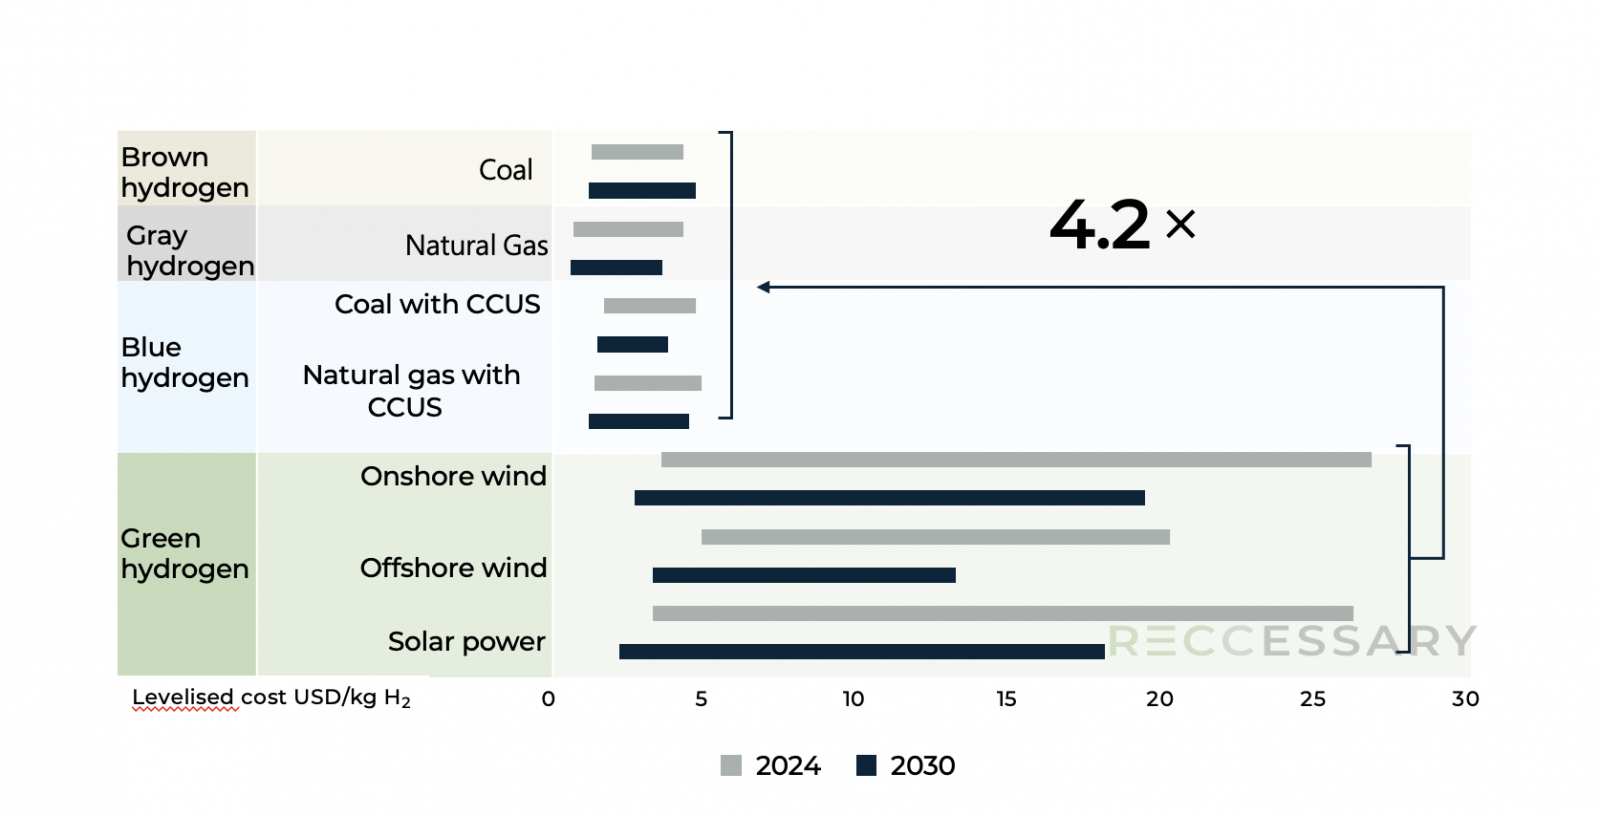
Figure 3. Levelized cost comparison of hydrogen production technologies (stated policies scenario, 2024–2030)
Cost as a barrier to green hydrogen adoption
In 2024, the levelized cost of brown hydrogen ranged from 1.4 to 4.4 USD per kg of H₂, while gray hydrogen was even lower. Although blue hydrogen incurs higher costs due to the addition of carbon capture technologies, its continued reliance on relatively inexpensive fossil fuels offsets these costs, allowing it to remain price competitive.
For green hydrogen, the cost of production using onshore wind ranges from about 3.7 to 26.9 USD per kg of H₂. Other renewable sources, such as offshore wind and solar power, exhibit similarly high costs, indicating that production cost remains a key constraint on its large-scale deployment.
As shown in Figure 3, under the stated policies scenario for 2024 and projections for 2030, the cost of green hydrogen is four times higher than that of hydrogen produced from fossil fuels. Unless natural gas prices rise significantly due to geopolitical factors, green hydrogen currently lacks cost competitiveness.
Regional variation in future green hydrogen costs
At present, green hydrogen is produced by using renewable electricity to power electrolyzers that split water into hydrogen and oxygen. However, high costs remain due to the price of renewable energy and the efficiency of the electrolysis process. Looking ahead, regions with large-scale deployment of electrolyzers and access to low-cost renewable energy are expected to achieve lower production costs.
Among these low-cost regions, China is the most representative. The country has made significant progress in reducing the cost of solar and wind power, and it controls nearly 60% of global electrolyzer manufacturing capacity. By 2030, the levelized cost of green hydrogen in China is projected to decline to 2.3–6 USD per kg of H₂, with the potential to reach cost competitiveness within the next decade.
Other low-cost regions include North America, where production costs are estimated at 4–10.9 USD per kg of H₂, and the Middle East, where abundant solar resources result in costs ranging from 4.8 to 11 USD per kg of H₂. However, due to relatively low natural gas prices in these regions, blue hydrogen produced with CCUS is likely to remain more competitive in the near term.
Green hydrogen industry and CBAM compliance
Manufacturing emissions from renewable energy equipment are excluded for now
Current regulations generally do not account for carbon emissions from the manufacturing of renewable energy equipment, and the Carbon Border Adjustment Mechanism (CBAM) follows a similar approach. Its monitoring, reporting, and verification (MRV) framework focuses on direct and indirect emissions from the production process rather than full life cycle emissions.
For example, in the case of hydrogen production via water electrolysis, CBAM guidelines explicitly define the system boundary for direct emissions as “all emissions from fuel use directly or indirectly linked to the hydrogen production process and from flue gas cleaning.”
Other hydrogen production pathways, such as steam methane reforming, follow the same principle. The system boundary includes only direct and indirect emissions from the production process.
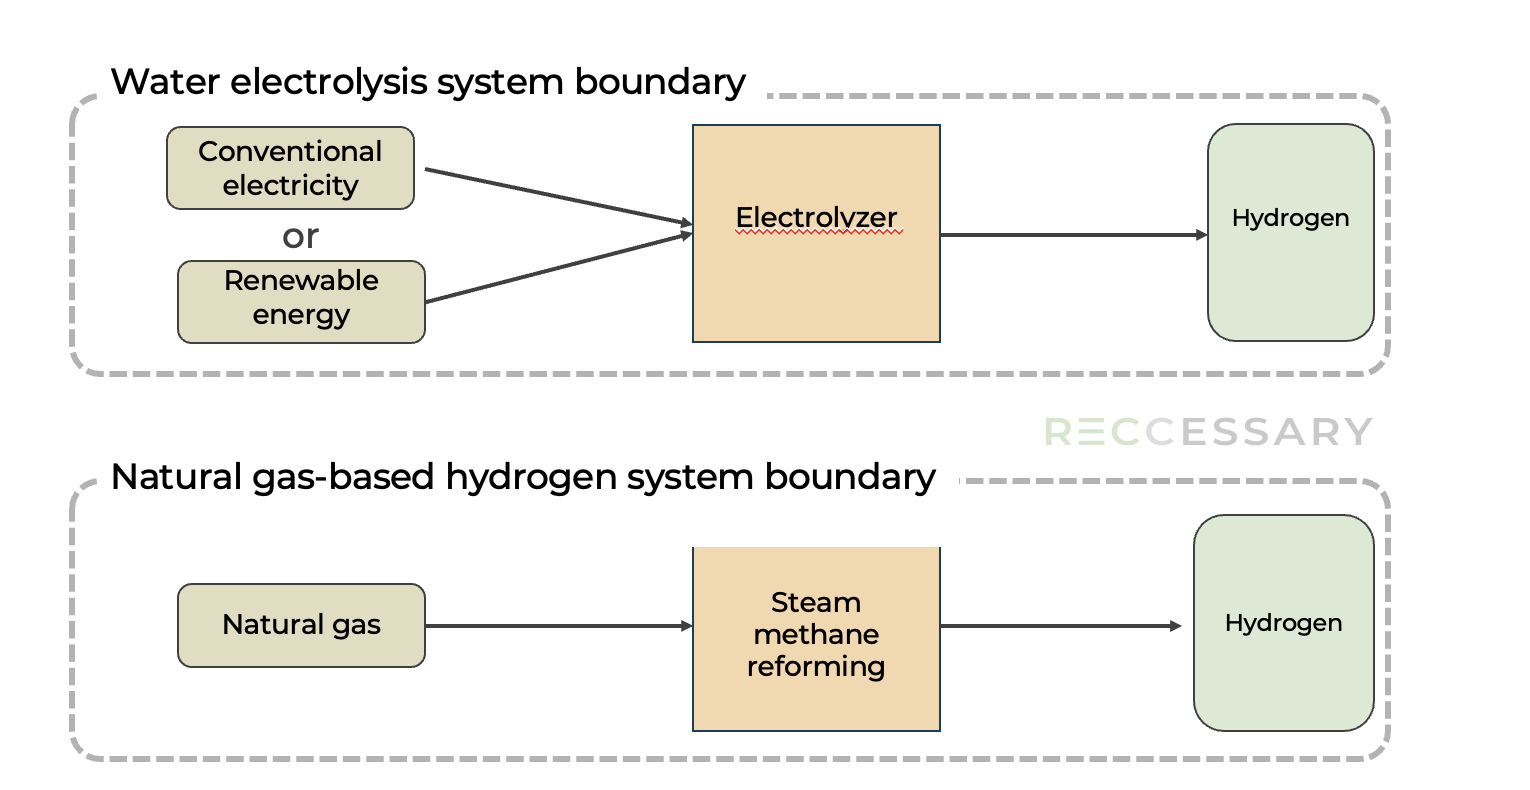
Figure 4. System boundaries of hydrogen production under the CBAM framework
In terms of indirect emissions, hydrogen production via water electrolysis results in indirect emissions from electricity consumption. However, if the electricity used in the production process complies with the renewable energy criteria defined under (EU) 2023/1184, a zero-emission factor may be applied. As a result, compliant green hydrogen under the CBAM framework can significantly reduce the tariff burden for importers during declaration.
References
[1][2]Based on IEA data; methodology: IPHE Well-to-Gate (covering Scope 1, Scope 2, and part of Scope 3). To align with current international standards, emissions from the manufacturing of solar panels and wind turbines are excluded from green hydrogen calculations, and the corresponding values are indicated by lines.
[3]Relative to other hydrogen production technologies
IEA, 2025: Global Hydrogen Review 2025
IEA, 2023: Towards hydrogen definitions based on their emissions intensity
European Commission, 2023: GUIDANCE DOCUMENT ON CBAM IMPLEMENTATION FOR INSTALLATION OPERATORS OUTSIDE THE EU
Update:2026/3/19
