Global emissions in the fertilizer industry
Nitrogen is an essential nutrient for plant growth. Since the introduction of synthetic nitrogen fertilizers in the early 20th century, their widespread use has significantly increased agricultural productivity while also contributing to substantial emissions. Today, emissions from the fertilizer industry, spanning production to farm use, account for around 2% of global greenhouse gas emissions.
The figure below shows per capita nitrogen fertilizer use across countries, reflecting differences in national reliance on nitrogen fertilizers.
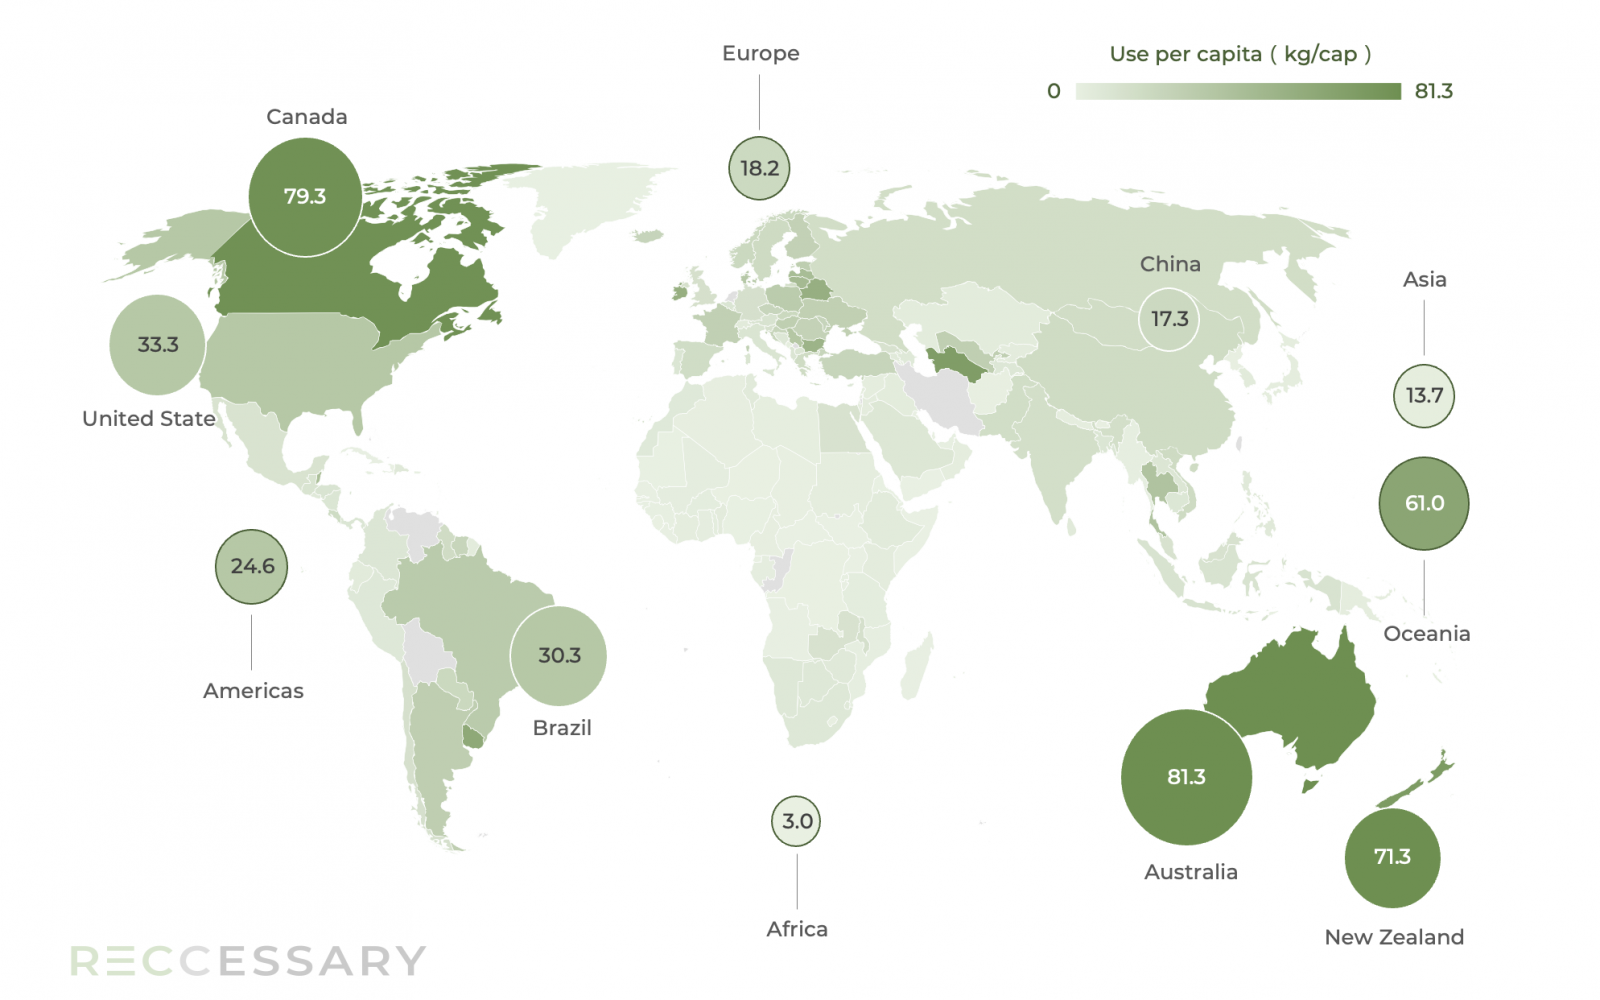
Figure 1. Per capita agricultural nitrogen fertilizer use, 2023
Oceania: High dependence on nitrogen fertilizers driven by poor soil quality and pasture demand
Australia and New Zealand are located on some of the oldest landmasses on Earth, where essential nutrients such as nitrogen (N) and phosphorus (P) have been extensively depleted through long-term weathering and leaching. As a result, maintaining agricultural productivity requires substantial external inputs of fertilizers.
In addition, New Zealand’s livestock sector is highly dependent on pasture. Nitrogen fertilizers are therefore widely applied to grasslands to ensure a stable supply of high-quality feed.
Americas: Higher urea intensity driven by harsh climatic conditions in North America
In the Canadian Prairie provinces (Saskatchewan, Alberta, and Manitoba), cold climates and short growing seasons lead farmers to rely on high-concentration urea, a nitrogen-based fertilizer derived from ammonia, particularly around the planting period.
Fertilizer policy directions in China and India
According to the Intergovernmental Panel on Climate Change (IPCC), China and India together account for roughly 50% of global agricultural emissions, with nitrogen fertilizers being a major contributing factor. Although per capita nitrogen fertilizer use in both countries remains relatively low, total consumption is among the highest globally. As shown in Figure 2, China and India rank first and second in total nitrogen fertilizer use, respectively.
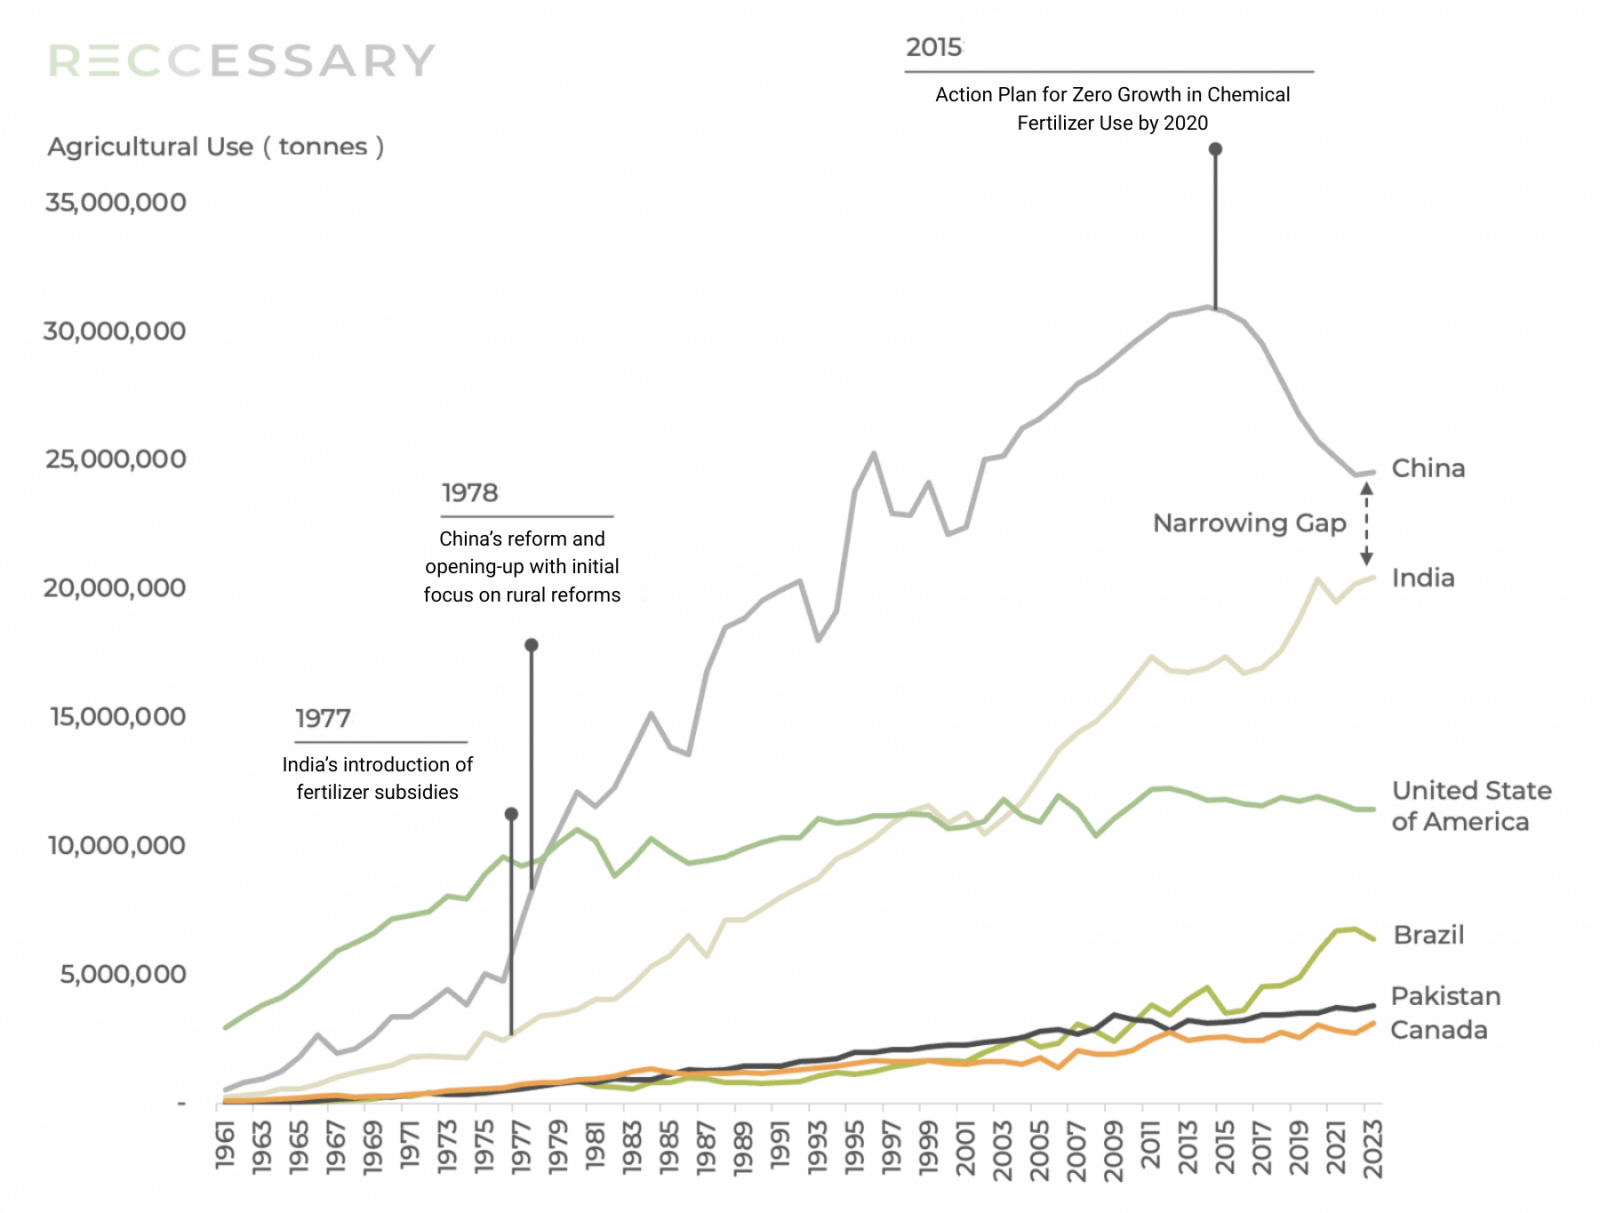
Figure 2. Top six countries by total nitrogen fertilizer consumption, 1961–2023
China: Policy-driven growth followed by a post-peak transition in nitrogen use
Following the launch of reform and opening-up in 1978, China prioritized rural reforms, leading to a surge in agricultural productivity and a rapid increase in fertilizer use. As a result, China became the world’s largest consumer of nitrogen fertilizers. However, after 2015, consumption declined sharply, driven by the following factors.
Supply side:
China’s domestic fertilizer industry initially benefited from preferential policies, including subsidies for transportation, electricity, and natural gas, which supported rapid expansion. Production capacity peaked in 2015. However, the subsequent withdrawal of these policy supports, combined with a sharp decline in exports, led to widespread plant shutdowns and forced many producers to exit the market.
Demand side:
In 2015, China introduced the Action Plan for Zero Growth in Chemical Fertilizer Use by 2020, aimed at improving fertilizer use efficiency and reducing application rates. This was followed by additional policy measures to upgrade agricultural practices, resulting in a sustained decline in total nitrogen fertilizer consumption.
India: Subsidy-driven growth with no clear peak in sight
Since 1961, agricultural nitrogen fertilizer use in India has increased rapidly, driven by the following factors.
Smallholder structure and over-application:
A large share of Indian farmers operates small plots and rely heavily on agricultural output for income. In the absence of precision farming techniques commonly used in large-scale operations, farmers tend to over-apply fertilizers to minimize the risk of yield fluctuations.
According to the 10th Agricultural Census of India, around 86% of farms are smaller than 2 hectares, accounting for 47% of total cultivated land. This highlights the dominance of smallholder farming. Research [1] further indicates that nitrogen application rates among smallholders in northern India exceed 200 kg/ha/year, which is two to four times higher than those observed in large-scale farms in Europe and the United States, underscoring the structural drivers of overuse.
Subsidy-driven increase in fertilizer use:
Since 1977, India has implemented fertilizer subsidies, with nitrogen (N) fertilizers consistently receiving subsidy rates of around 70%. This has distorted nutrient use patterns, leading farmers to reduce the application of lower-emission phosphorus (P) and potassium (K) fertilizers in favor of more heavily subsidized and lower-cost nitrogen fertilizers.
Domestic production reinforcing high nitrogen use patterns:
In pursuit of urea self-sufficiency, India has announced plans to phase out urea imports by the end of 2025 while restarting several domestic urea plants. At the same time, financial support has increasingly shifted toward domestic urea production, with subsidies growing at a compound annual rate of 11.3% in recent years. This has ensured a more stable supply of nitrogen fertilizers for farmers, as illustrated in the figure below.
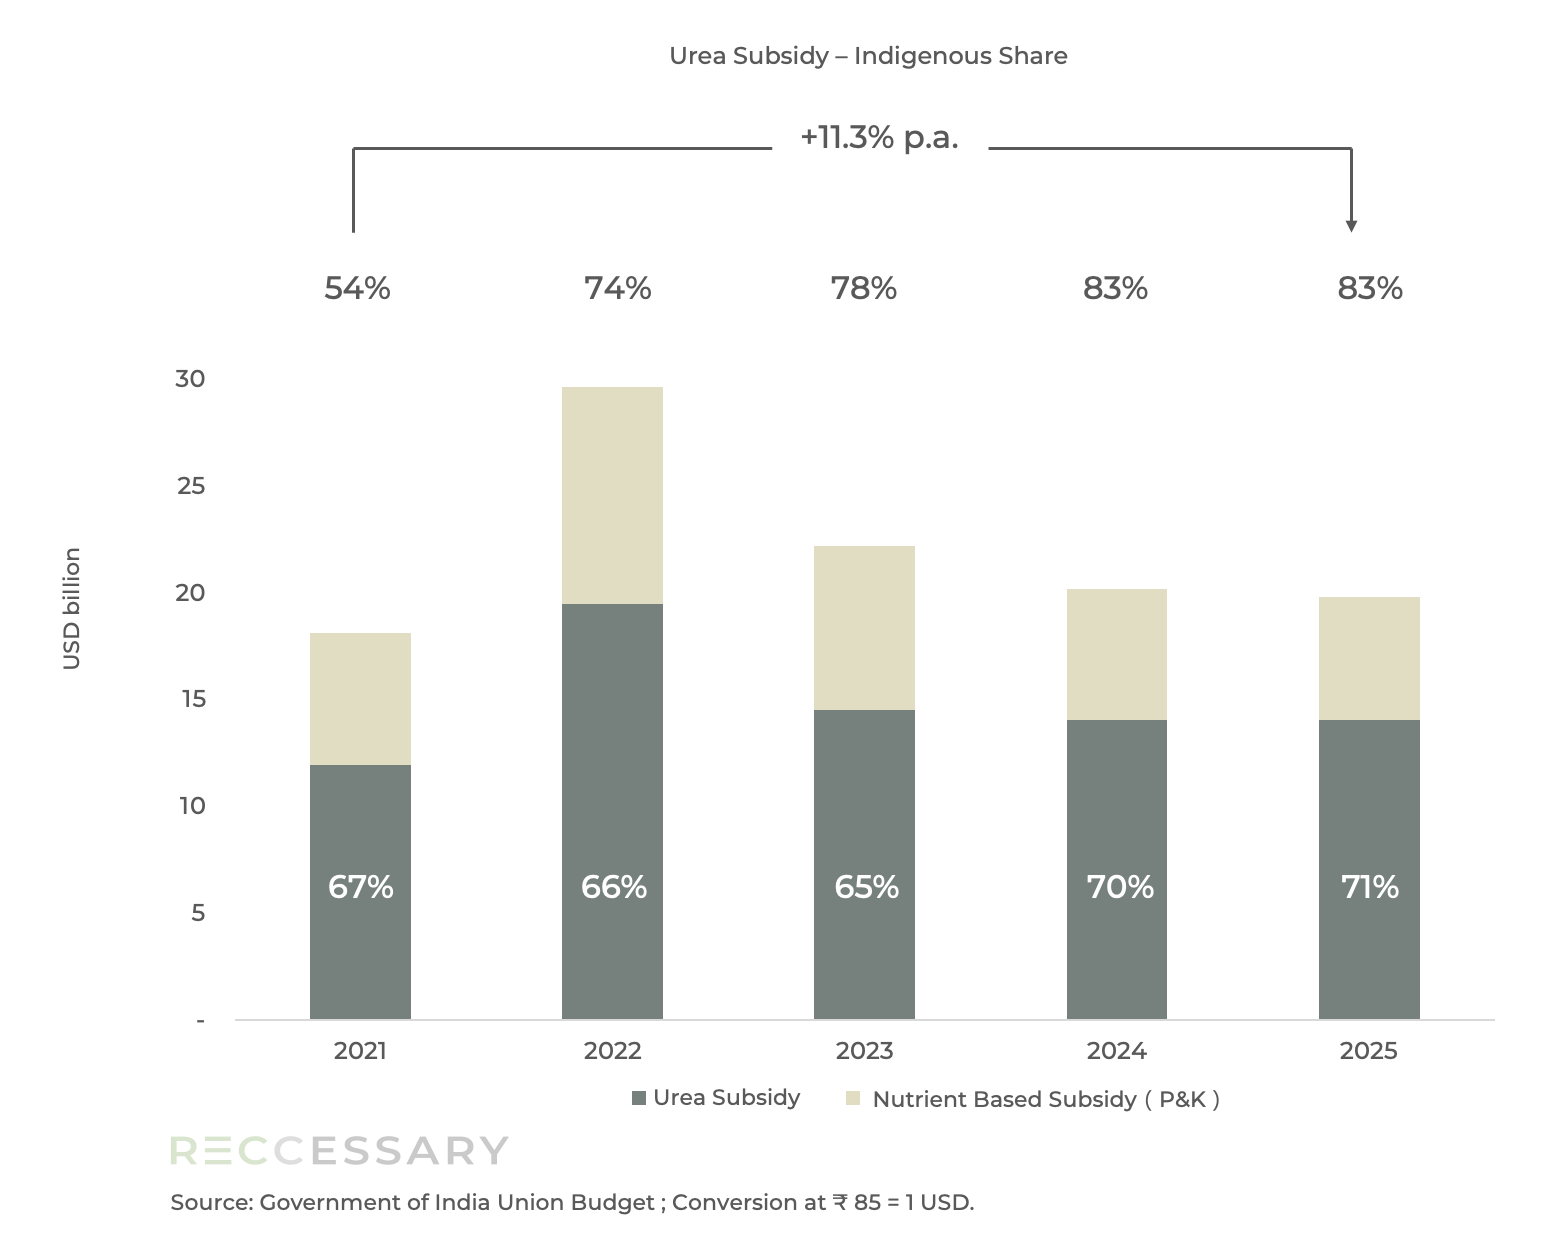
Figure 3. Trends in nitrogen, phosphorus, and potassium subsidies and domestic production structure in India
Emission factors
Fertilizers are generally classified into three main categories. Nitrogen fertilizers promote leaf and vegetative growth, thereby increasing crop yields. Phosphorus fertilizers support flowering and fruit development, while potassium fertilizers enhance disease resistance and improve crop quality.
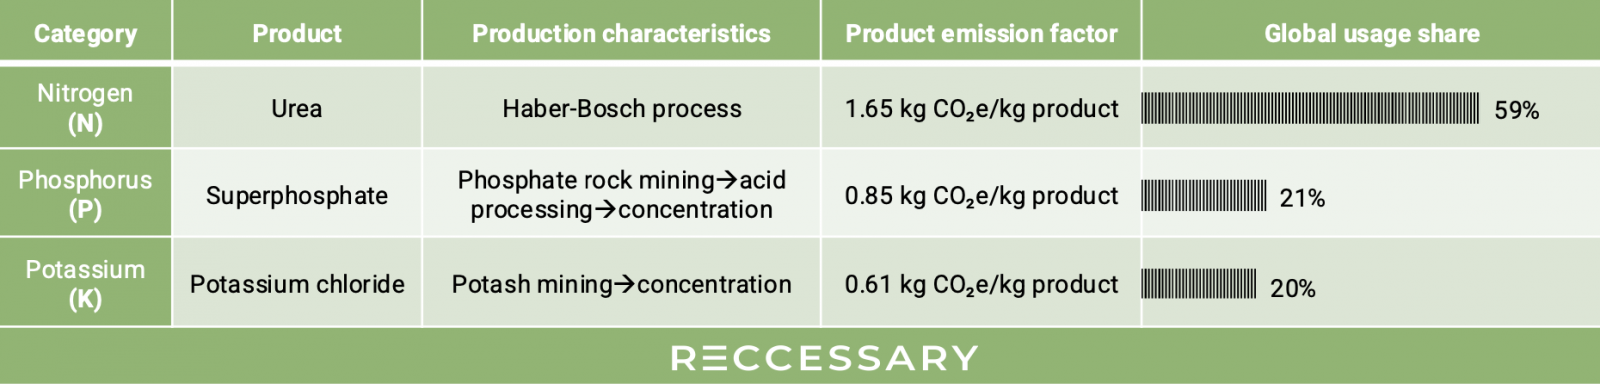
Table 1. Overview of characteristics of the three major fertilizer types
Nitrogen fertilizers:
N2(g)+3H2(g) ⟷ 2NH3(g)
The dominant production method is the Haber-Bosch process, which requires three key conditions, all of which contribute to significant emissions:
- Hydrogen production, which is then combined with nitrogen to synthesize ammonia.
- High temperatures (400–500°C) to break the strong N≡N triple bond in nitrogen molecules
- High pressures (150–350 atm) to shift the reaction equilibrium toward the side with fewer gas molecules, favoring ammonia (NH3) formation.
During the process, about 40% of fossil fuel consumption is used for hydrogen production. The high temperatures required to break molecular bonds rely heavily on natural gas, while maintaining high pressure requires substantial electricity input. Together, these factors result in high overall carbon emissions.
Phosphorus fertilizers:
Ca3(PO4)2+2H2SO4+4H2O ⭢ 2H3PO4+3CaSO4⋅2H2O
This reaction produces phosphoric acid (H₃PO₄), which can be absorbed by plants, along with the by-product phosphogypsum (CaSO₄·2H₂O). Although overall carbon emissions are relatively low, improper disposal or storage of phosphogypsum may lead to environmental impacts, such as groundwater contamination.
Potassium fertilizers:
Potassium fertilizers are derived from water-soluble potash ores. After extraction, they typically require basic physical processing before being used as fertilizers, resulting in relatively low emissions.
Decarbonization strategies in the fertilizer industry
Among the three major fertilizer types, nitrogen fertilizers present the greatest challenge for decarbonization due to their high usage and high emissions. Current mitigation approaches can be broadly divided into production-side and application-side measures.
Production side: reducing emissions at the source
Low-carbon hydrogen for ammonia production
Hydrogen produced via water electrolysis using renewable energy can be used to synthesize ammonia, significantly reducing emissions during the production process compared with conventional methods such as natural gas reforming or coal gasification. In addition, the resulting green hydrogen and green ammonia can serve as alternative fuels in sectors such as shipping.
Carbon capture and storage (CCS)
This approach involves capturing carbon dioxide emissions from industrial processes and storing them underground. For example, a CCS project jointly developed by Yara International and Northern Lights aims to capture and store around 0.8 million tonnes of CO2 annually at an ammonia production facility.
Application side: mitigating nitrous oxide (N₂O) emissions
The 4R Framework
- Right source: selecting the appropriate type of fertilizer.
- Right rate: applying fertilizers at the optimal amount.
- Right time: applying fertilizers at the appropriate timing.
- Right place: applying fertilizers in the correct location.
In addition to emissions from production, nitrogen fertilizer application also generates nitrous oxide (N₂O), a potent greenhouse gas that contributes to stratospheric ozone depletion. The 4R framework aims to improve nutrient use efficiency while reducing N₂O emissions.
The fertilizer industry is included among the six carbon-intensive sectors covered under the EU’s Carbon Border Adjustment Mechanism (CBAM). For organizations navigating carbon accounting, CBAM compliance, or decarbonization strategies, RECCESSARY provides tailored solutions to support effective carbon management and regulatory alignment.
Source
[1] Liu, Pu, et al., 2023: Farming the planet with better nitrogen use.
IPCC, 2019: Food Security. In Special Report on Climate Change and Land.
IEA, 2021: Ammonia Technology Roadmap: Towards more sustainable nitrogen fertiliser production.
IFC, 2023: Strengthening sustainability in the fertilizer industry.
Updated: 2026/4/15
